pprof 是什么
[TOC]
pprof 是用于可视化和分析性能分析数据的工具
可以做什么
- CPU Profiling:CPU 分析,按照一定的频率采集所监听的应用程序 CPU(含寄存器)的使用情况,可确定应用程序在主动消耗 CPU 周期时花费时间的位置
- Memory Profiling:内存分析,在应用程序进行堆分配时记录堆栈跟踪,用于监视当前和历史内存使用情况,以及检查内存泄漏
- Block Profiling:阻塞分析,记录 goroutine 阻塞等待同步(包括定时器通道)的位置
- Mutex Profiling:互斥锁分析,报告互斥锁的竞争情况
实践
一个简单的demo
1
2
3
4
5
6
7
8
9
10
11
12
13
14
15
16
17
18
19
20
21
22
23
24
25
26
27
28
29
30
31
32
33
34
35
| package main
import (
"fmt"
"net/http"
_ "net/http/pprof"
"time"
)
func test() {
for i := 0; true; i ++{
go func(i int) {
fmt.Printf("sleep i%d start\n", i)
time.Sleep(10 * time.Second)
fmt.Printf("sleep i%d end\n", i)
}(i)
time.Sleep(1 * time.Second)
}
}
func main() {
ip := "0.0.0.0:6060"
go test()
fmt.Println( http.ListenAndServe(ip, nil))
}
|
分析
web 页分析
访问 http://127.0.0.1:6060/debug/pprof/
各个选项的作用
- profile:CPU profile,$HOST/debug/pprof/profile,默认进行 30s 的 CPU Profiling,得到一个分析用的 profile 文件,使用
go tool pprof command 来分析数据
- allocs:所有过去内存分配的采样
- block(Block Profiling):
$HOST/debug/pprof/block,查看导致阻塞同步的堆栈跟踪
- goroutine:
$HOST/debug/pprof/goroutine,查看当前所有运行的 goroutines 堆栈跟踪
- heap(Memory Profiling):
$HOST/debug/pprof/heap,查看活动对象的内存分配情况
- threadcreate:
$HOST/debug/pprof/threadcreate,查看创建新OS线程的堆栈跟踪
终端分析
获取cpu
1
2
3
4
5
6
7
8
9
10
11
12
13
14
15
16
17
18
19
20
| go tool pprof http://localhost:6060/debug/pprof/profile?seconds=60
# 完成后执行
top10
# 如果退出后,可直接使用文件
go tool pprof pprof.qc-misc.samples.cpu.001.pb.gz
go tool pprof http://localhost:18089/debug/pprof/profile?seconds=60
go tool pprof http://localhost:18089/debug/pprof/heap
# 堆内存分析的默认“类型”是“在用内存”。还有一种“类型”,表示程序在整个生命周期分配的内存总量,可以使用 -alloc_space 标识切换到这种模式:
# 可以根据自己的需要,选择 -inuse_space 或者 -alloc_space 标签。例如,在考察垃圾回收的性能时,你需要的就是 -alloc_space。
# 要考察生成对象的数量,可以用 -inuse_objects 和 -alloc_objects 标签。
go tool pprof -alloc_space http://localhost:18089/debug/pprof/heap
# 调用 runtime.gcDrain 扫描工作缓冲区 runtime.gcWork。在调用 runtime.gcDrain 函数时,运行时会传入处理器上的 runtime.gcWork,这个结构体是垃圾收集器中工作池的抽象,它实现了一个生产者和消费者的模型,我们可以以该结构体为起点从整体理解标记工作。
# 运行时会使用 runtime.gcDrain 函数扫描工作缓冲区中的灰色对象,它会根据传入 gcDrainFlags 的不同选择不同的策略:
|
名称释义
- flat:给定函数上运行耗时
- flat%:给定函数上运行耗时总比例
- sum%:给定函数累积使用 CPU 总比例
- cum:当前函数加上它之上的调用运行总耗时
- cum%:当前函数加上它之上的调用运行总耗时比例,假如main函数调用了函数f,函数f占用的内存量,也会记进来。
测试-火焰图
1
2
3
4
5
6
7
8
9
10
11
12
13
14
15
16
17
18
19
20
21
22
23
24
25
26
27
28
| package test
import "testing"
const url = "https://github.com/EDDYCJY"
var datas []string
func Add(str string) string {
data := []byte(str)
sData := string(data)
datas = append(datas, sData)
return sData
}
func TestAdd(t *testing.T) {
s := Add(url)
if s == "" {
t.Errorf("Test.Add error!")
}
}
func BenchmarkAdd(b *testing.B) {
for i := 0; i < b.N; i++ {
Add(url)
}
}
|
启动 PProf 可视化界面
1
2
3
| # 通过go 安装这个功能,go get -u github.com/google/pprof
pprof -http=:8080 cpu.prof
# 调用顺序由上到下(A -> B -> C -> D),每一块代表一个函数,越大代表占用 CPU 的时间更长。同时它也支持点击块深入进行分析!
|
web ui
重点!!!
1
2
|
pprof -http=:8080 pprof.samples.cpu.002.pb.gz
|
goroutine泄露
如果你启动了1个goroutine,但并没有符合预期的退出,直到程序结束,此goroutine才退出,这种情况就是goroutine泄露。
每个goroutine占用2KB内存,泄露1百万goroutine至少泄露2KB * 1000000 = 2GB内存,为什么说至少呢?因为goroutine执行过程中还存在一些变量,如果这些变量指向堆内存中的内存,GC会认为这些内存仍在使用,不会对其进行回收,这些内存谁都无法使用,造成了内存泄露。
所以goroutine泄露有2种方式造成内存泄露:
- goroutine本身的栈所占用的空间造成内存泄露。
- goroutine中的变量所占用的堆内存导致堆内存泄露,这一部分是能通过heap profile体现出来的。
goroutine泄露的demo
1
2
3
4
5
6
7
8
9
10
11
12
13
14
15
16
17
18
19
20
21
22
23
24
25
26
27
28
29
30
31
32
33
34
35
36
37
38
39
40
41
42
43
44
45
46
47
48
49
50
51
52
53
54
55
|
package main
import (
"fmt"
"net/http"
_ "net/http/pprof"
"os"
"time"
)
func main() {
go func() {
ip := "0.0.0.0:6060"
if err := http.ListenAndServe(ip, nil); err != nil {
fmt.Printf("start pprof failed on %s\n", ip)
os.Exit(1)
}
}()
outCh := make(chan int)
go func() {
if false {
<-outCh
}
select {}
}()
tick := time.Tick(time.Second / 100)
i := 0
for range tick {
i++
fmt.Println(i)
alloc1(outCh)
}
}
func alloc1(outCh chan<- int) {
go alloc2(outCh)
}
func alloc2(outCh chan<- int) {
func() {
defer fmt.Println("alloc-fm exit")
buf := make([]byte, 1024*1024*10)
_ = len(buf)
fmt.Println("alloc done")
outCh <- 0
}()
}
|
1
2
3
4
5
6
7
8
9
10
11
12
13
14
15
16
17
18
19
20
21
22
23
24
25
26
27
28
29
30
31
32
| # 执行goroutine采样
go tool pprof http://localhost:6060/debug/pprof/goroutine
# kill掉,并再次执行
go tool pprof http://localhost:6060/debug/pprof/goroutine
# 执行对比
go tool pprof -base pprof.goroutine.001.pb.gz pprof.goroutine.002.pb.gz
Showing nodes accounting for 646, 100% of 646 total
flat flat% sum% cum cum%
646 100% 100% 646 100% runtime.gopark
0 0% 100% 646 100% main.alloc2
0 0% 100% 646 100% main.alloc2.func1
0 0% 100% 646 100% runtime.chansend
0 0% 100% 646 100% runtime.chansend1
0 0% 100% 646 100% runtime.goparkunlock
# 可以看到goroutine 增加了646个,再单看002
go tool pprof pprof.goroutine.002.pb.gz
Showing nodes accounting for 895, 99.89% of 896 total
Dropped 33 nodes (cum <= 4)
flat flat% sum% cum cum%
895 99.89% 99.89% 895 99.89% runtime.gopark
0 0% 99.89% 891 99.44% main.alloc2
0 0% 99.89% 891 99.44% main.alloc2.func1
0 0% 99.89% 891 99.44% runtime.chansend
0 0% 99.89% 891 99.44% runtime.chansend1
0 0% 99.89% 892 99.55% runtime.goparkunlock
显示有895个goroutine被挂起,这不是goroutine泄露这是啥?已经能确定八九成goroutine泄露了。
|
Web可视化查看goroutine泄露
访问 http://localhost:6060/debug/pprof/goroutine?debug=1
1
2
3
4
5
6
7
8
9
10
11
12
13
14
15
16
17
18
19
| goroutine profile: total 7876 (总的goroutine)
7871 (这个函数的goroutine) @ 0x4322a4 0x404db9 0x404d8f 0x404b65 0x72d7b9 0x72d472 0x45d761
# 0x72d7b8 main.alloc2.func1+0x118 C:/Users/13722/data/gopath/src/github.com/ivalue2333/go-science/framework/pprof_demo/first/main2.go:53 (显然是这里泄露了)
# 0x72d471 main.alloc2+0x31 C:/Users/13722/data/gopath/src/github.com/ivalue2333/go-science/framework/pprof_demo/first/main2.go:54
1 @ 0x403e15 0x44c42a 0x4a710c 0x4c54d3 0x56e903 0x56fb6b 0x589989 0x58825f 0x6a1a16 0x6a0844 0x6a057b 0x72d583 0x72d529 0x45d761
# 0x44c429 syscall.Syscall+0xe9 C:/Users/13722/data/software/go1.12.9/go/src/runtime/syscall_windows.go:184
# 0x4a710b syscall.SetFileCompletionNotificationModes+0x6b C:/Users/13722/data/software/go1.12.9/go/src/syscall/zsyscall_windows.go:1747
# 0x4c54d2 internal/poll.(*FD).Init+0x102 C:/Users/13722/data/software/go1.12.9/go/src/internal/poll/fd_windows.go:395
# 0x56e902 net.(*netFD).init+0x52 C:/Users/13722/data/software/go1.12.9/go/src/net/fd_windows.go:56
# 0x56fb6a net.(*netFD).accept+0x2aa C:/Users/13722/data/software/go1.12.9/go/src/net/fd_windows.go:210
# 0x589988 net.(*TCPListener).accept+0x38 C:/Users/13722/data/software/go1.12.9/go/src/net/tcpsock_posix.go:139
# 0x58825e net.(*TCPListener).AcceptTCP+0x4e C:/Users/13722/data/software/go1.12.9/go/src/net/tcpsock.go:247
# 0x6a1a15 net/http.tcpKeepAliveListener.Accept+0x35 C:/Users/13722/data/software/go1.12.9/go/src/net/http/server.go:3264
# 0x6a0843 net/http.(*Server).Serve+0x233 C:/Users/13722/data/software/go1.12.9/go/src/net/http/server.go:2859
# 0x6a057a net/http.(*Server).ListenAndServe+0xea C:/Users/13722/data/software/go1.12.9/go/src/net/http/server.go:2797
# 0x72d582 net/http.ListenAndServe+0x82 C:/Users/13722/data/software/go1.12.9/go/src/net/http/server.go:3037
# 0x72d528 main.main.func1+0x28 C:/Users/13722/data/gopath/src/github.com/ivalue2333/go-science/framework/pprof_demo/first/main2.go:16
|
命令行交互式方法
1
2
3
4
5
6
7
| go tool pprof -base pprof.leak_demo.goroutine.001.pb.gz pprof.leak_demo.goroutine.002.pb.gz
traces
# traces能列出002中比001中多的那些goroutine的调用栈,这里只有1个调用栈,有20312个goroutine都执行这个调用路径,可以看到alloc2中的匿名函数alloc2.func1调用了写channel的操作,然后阻塞挂起了goroutine,使用list列出alloc2.func1的代码,显示有20312个goroutine阻塞在53行:
list main.alloc2.func1
|
一些指令
生成图像
1
2
|
go tool pprof -png http://localhost:6060/debug/pprof/heap > data.png
|
--inuse/alloc_space --inuse/alloc_objects区别
通常情况下:
- 用
--inuse_space来分析程序常驻内存的占用情况;
- 用
--alloc_objects来分析内存的临时分配情况,可以提高程序的运行速度。
输出理解
heap
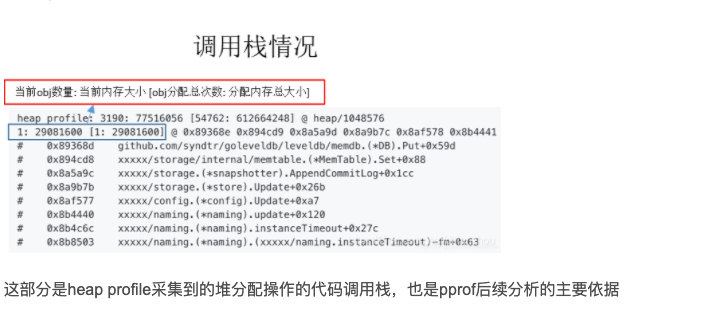
总结
goroutine泄露的本质
goroutine泄露的本质是channel阻塞,无法继续向下执行,导致此goroutine关联的内存都无法释放,进一步造成内存泄露。
goroutine泄露的发现和定位
利用好go pprof获取goroutine profile文件,然后利用3个命令top、traces、list定位内存泄露的原因。
goroutine泄露的场景
泄露的场景不仅限于以下两类,但因channel相关的泄露是最多的。
- channel的读或者写:
- 无缓冲channel的阻塞通常是写操作因为没有读而阻塞
- 有缓冲的channel因为缓冲区满了,写操作阻塞
- 期待从channel读数据,结果没有goroutine写
- select操作,select里也是channel操作,如果所有case上的操作阻塞,goroutine也无法继续执行。
编码goroutine泄露的建议
为避免goroutine泄露造成内存泄露,启动goroutine前要思考清楚:
- goroutine如何退出?
- 是否会有阻塞造成无法退出?如果有,那么这个路径是否会创建大量的goroutine?
一次问题分析
1
2
3
4
5
6
7
8
9
| # 前面分析了porfile,发现频繁GC,于是分析内存,分析实时内存效果不佳,开始分析累计内存
# (不到1分钟执行两次下面操作)看下面的结果,很明显能看到,不到一分钟的时间,NewLeechedGinResponseWriter这个函数申请了6个G的内存,这个肯定就是代码有问题了。
go tool pprof -alloc_space http://localhost:18089/debug/pprof/heap
# 350.43GB 33.95% 33.95% 350.43GB 33.95% github.com/nickxb/gin-http-logger.NewLeechedGinResponseWriter
go tool pprof -alloc_space http://localhost:18089/debug/pprof/heap
# 356.08GB 33.98% 33.98% 356.08GB 33.98% github.com/nickxb/gin-http-logger.NewLeechedGinResponseWriter
|
使用
1
2
3
4
5
6
7
8
9
10
11
12
13
14
15
16
17
18
19
20
21
22
23
24
25
26
27
28
29
30
31
|
http://10.112.4.199:9499/debug/pprof/
go tool pprof -alloc_space http://10.112.4.199:9499/debug/pprof/profile
go tool pprof -alloc_space http://10.145.49.36:9385//debug/pprof/heap\?seconds=10
go tool pprof http://10.112.4.199:9499/debug/pprof/profile\?seconds\=10s -output cpu.pprof
go tool pprof -png http://10.112.4.199:9499/debug/pprof/heap\?seconds\=10 > data.png
go tool pprof -http :8888 http://ip:port/debug/pprof/
go tool pprof -http :8888 http://10.22.31.47:9489/debug/pprof/
go tool pprof -http :8888 http://fdbd:dc02:4:239::19:9211/debug/pprof/
go get -u github.com/google/pprof
brew install graphviz
pprof -http=:8080 cpu.prof
go tool pprof http://fdbd:dc02:108:311::172:9370/debug/pprof/heap?seconds\=20s
top10
top20 -cum
traces
list
|
参考
煎鱼pprof文章,很适合入门
入门文章
go pprof
heap pprof 含义